
July 1, 2019
The Business Launch Simulation
6 minute read
You’ve created the plan to turn your idea into a business or a business canvas and you’re ready to launch and start learning! But maybe you should tap the brakes. When an architect has a blueprint for a skyscraper ready, their next step isn’t to start building. Instead, they run simulations on the building design, which is way cheaper and less time consuming. Best to learn where your plan won’t “hold up” BEFORE you start building! Similarly, an aerospace engineer wouldn’t build and launch a rocket without first testing its design in a simulator to learn how it holds up and to identify opportunities to reach higher heights with greater efficiency.
“I hear you, but you can’t really simulate the launch of a business” is a response we often hear. To the skeptics, we typically reply, “so, you’re saying that launching a business is more complicated than rocket science?” Then, we step back and clarify. People generally agree that you can simulate a business launch (finance departments do it all the time), so what they really mean is that they agree simulations can be run to help identify and manage risk, but it’s not very helpful beyond that. We’d disagree and argue that usefulness is not a result of the simulation tool, but rather, it’s a function of how the tool is used.
Building Valuable Simulations
Today, some companies use Monte Carlo (MC) and the more complex Markov Chain Monte Carlo (MCMC) simulations, mostly as a tool to evaluate project risk. A number of inputs are entered into the simulator and an outcome distribution curve is generated. From this curve, Finance assesses the project’s expected value and the downside risk and the inputs that are driving the risk.
While helpful, this utilizes only a small portion of the tool’s power. To maximize this tool, teams need to 1) focus on both the risk AND the upside parts of the curve, and 2) use inputs that tie to activities that teams can control (e.g. instead of inputting “sales,” input activities where teams can deliver performance like click-thru rate, conversion rate, purchase intent, etc.).
Let’s first focus on the risk and upside parts of the curve. A standard Monte Carlo simulation would have 10,000 simulated outcomes and the results would be plotted on a graph (example below) with the x-axis having the outcome values and the y-axis plotting the frequency of that outcome occurring during the 10,000 simulations.
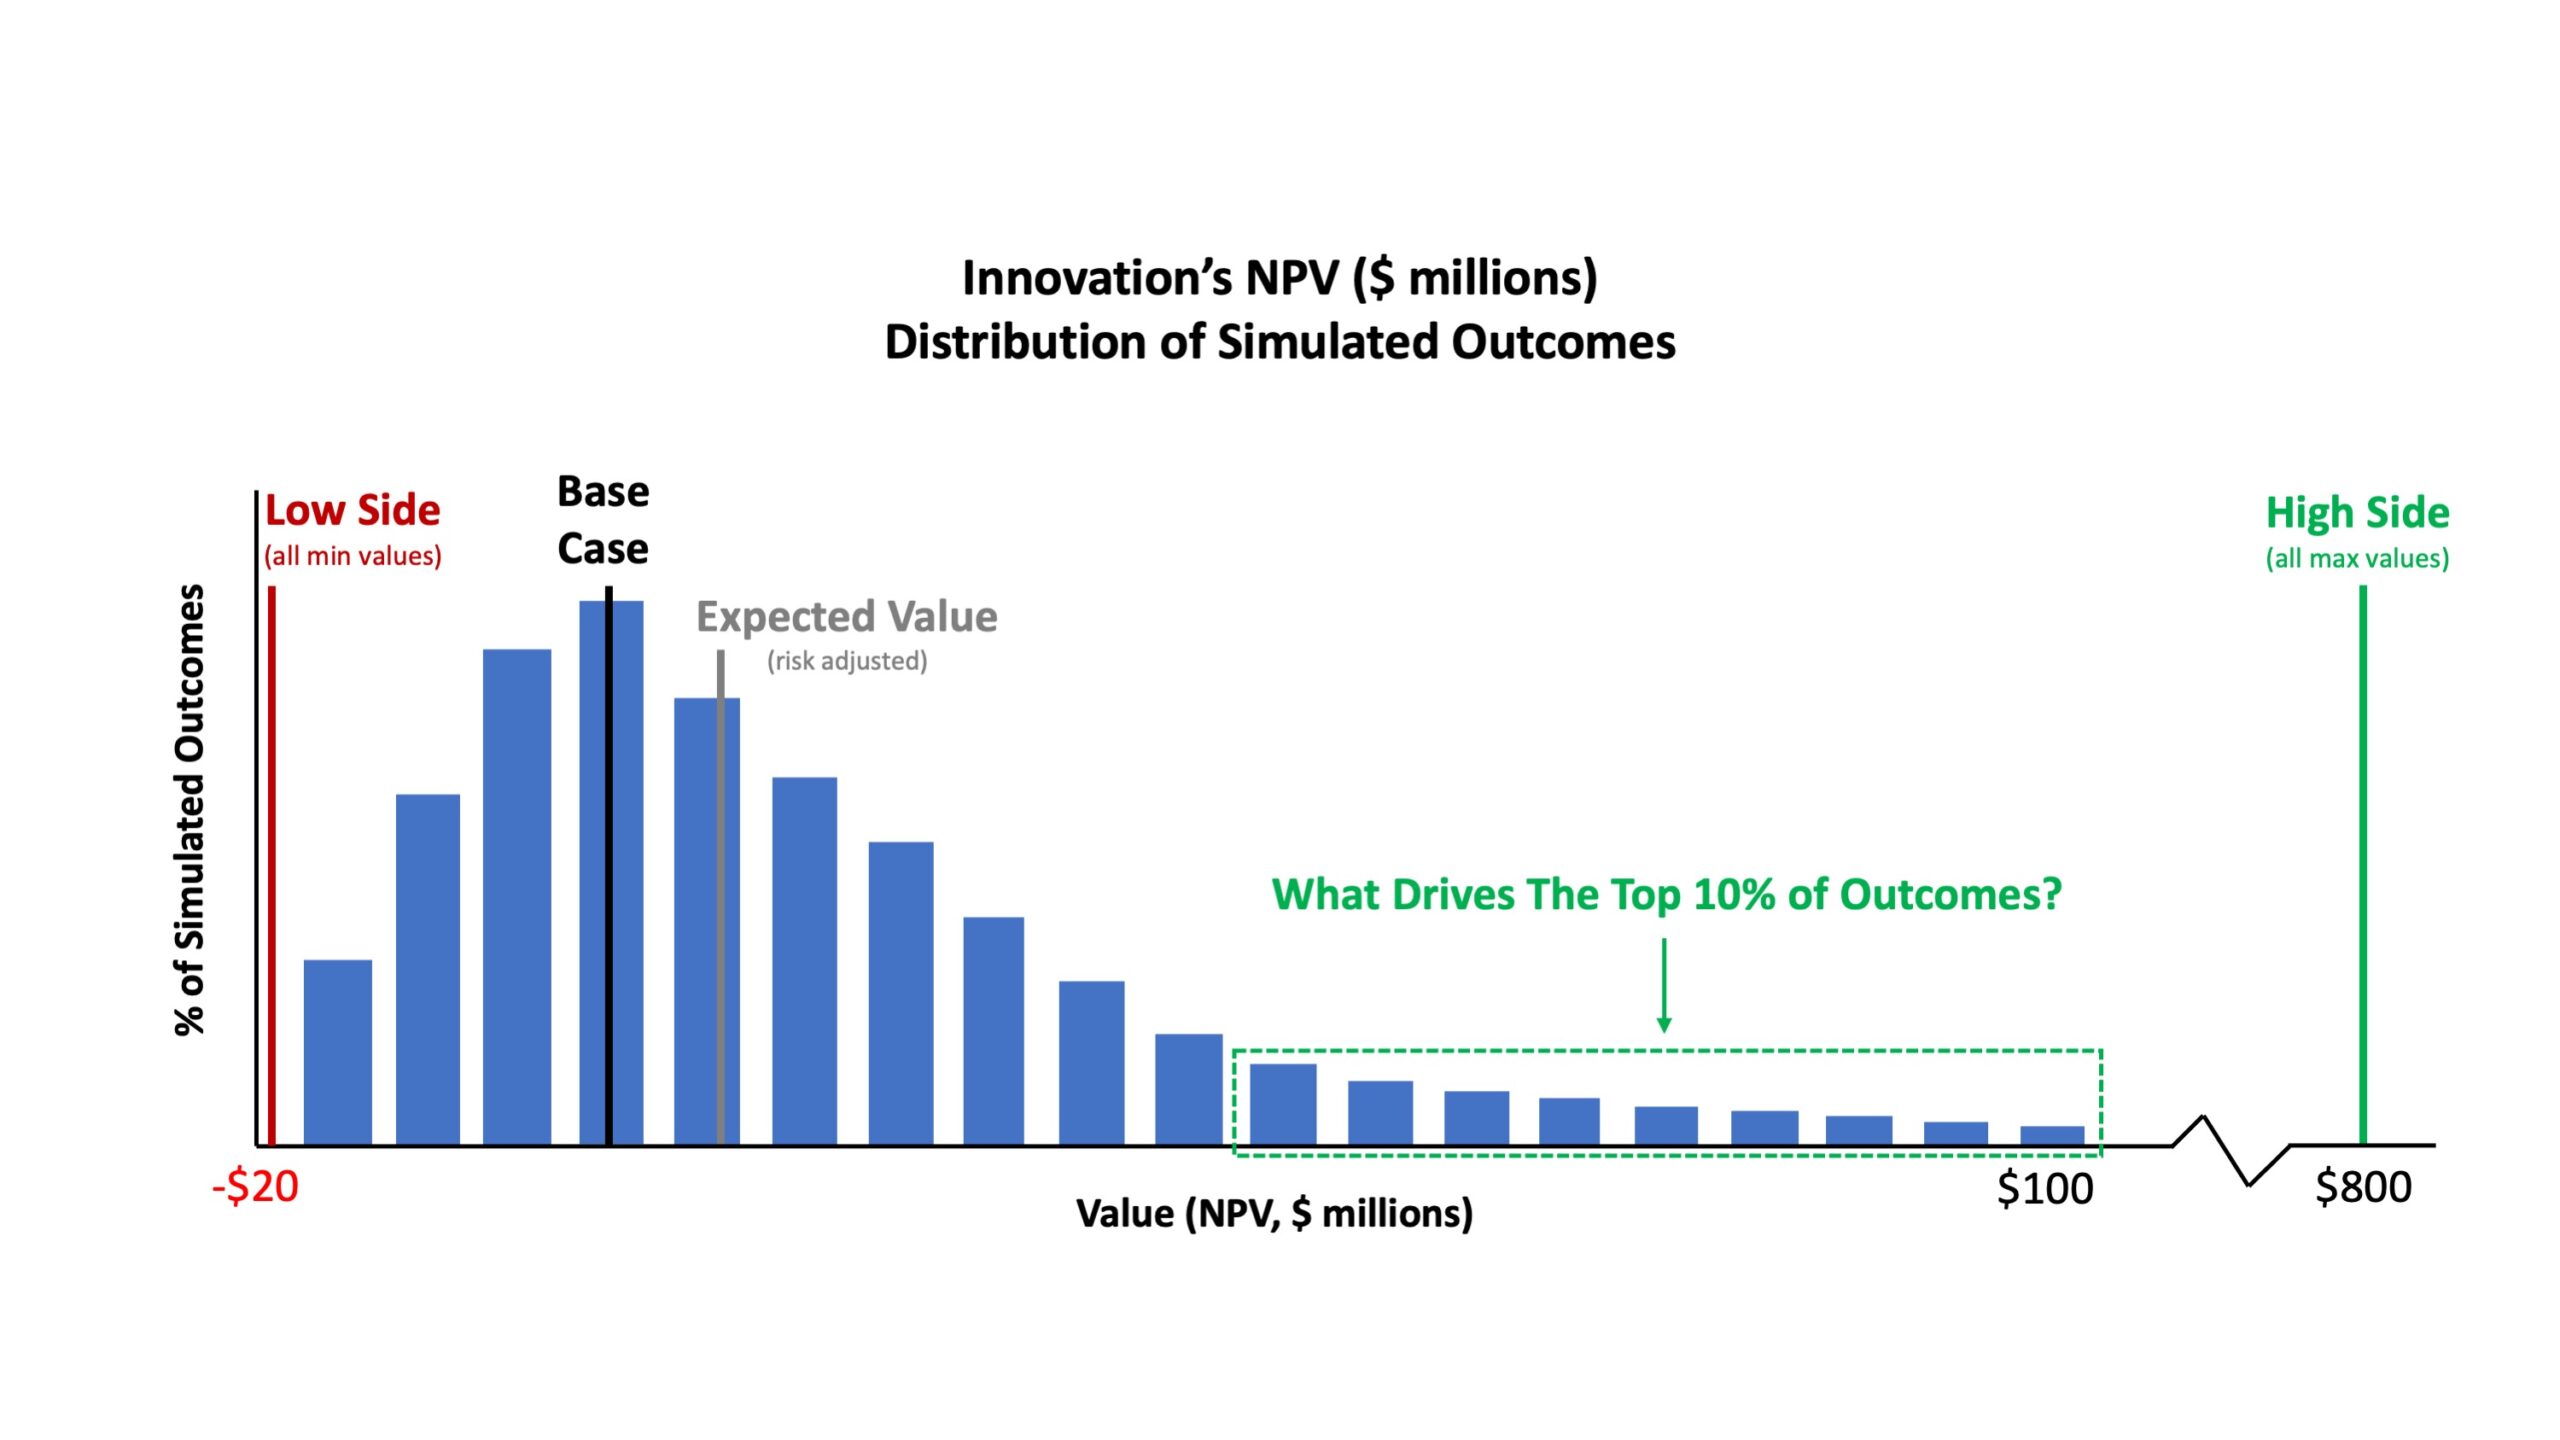
With this, most companies look at the expected value and assess if the project is big enough to pursue. If the business is big enough, the focus then typically changes to what can be done to manage the risk (the outcomes below the expected value), ignoring or placing minimal effort to understand what specifically can be done to deliver an outcome ABOVE the expected value. And this is where the true power of the tool is missed because the inputs used in the simulation don’t tie to activities that teams can control.
Understanding Simulation Risk AND Upside
Stepping back, the core idea behind the MC simulations is to add more information to a financial model than just a Base, High and Low estimate for the input. This additional information comes in through the probability assigned to each value within the range. For example, an input for a retail distribution range a product could achieve may have High and Low estimates, but the simulation inputs could change dramatically depending upon the input having a normal or a gamma right “statistical distribution.”
So getting that distribution right can unlock a lot of potential learning from a simulation tool. Two items drive the statistical distribution: sampling range variability and activity performance variability.
Sampling Range Variability: Sampling range variability is a statistical variability found in the data source (e.g. concept research with a base size of 50 will have a greater variability range than a range on research with a 750 base size). With this variability, it’s important to understand how important the variable is to the overall performance of the business before deciding if more research is needed. With these types of variables, we often see big companies “over-researching” to tighten the variability range when the range has a minimal impact on the overall business performance.
Activity Performance Variability: Activity performance variability is different; it’s driven by the team’s capability and capacity to deliver results while performing the activity. For example, a team may promise to deliver a 10% trial rate. To understand the performance variability, this metric needs to be broken down to the activity level. For example, delivering trial can be broken down into a) driving awareness, b) messaging effectively to compel purchase, and c) having sufficient distribution to enable the “aware” and “interested” to buy the next time they’re shopping. Each one of these “activity-level building blocks” has a performance range around it. For example, if the sales team performs at a high level (driven by capability or capacity), it could achieve 80% ACV weighted distribution. If it performs at a low level (again, driven by capability or capacity) it could achieve 40% ACV weighted distribution. Understanding the performance range – and the expected shape of the performance curve (e.g. are we more likely to be at the high or low end of the range) – at the activity level delivers two important benefits. First, it enables us to understand the range of business potential within the context of the range across all activity-level building blocks. Second, it enables teams to understand the relative importance of each activity and focus their efforts against the activities that matter most – ensuring they have the right capabilities in place, with enough capacity to deliver the performance required to achieve the business objectives.
Key Points
- Launching into market is one way to better understand how a business will work, however, simulations oftentimes provide cheaper and faster learning.
- While simulating the launch of a business can help a team understand financial potential, they can also be used to better understand the activities that are most important to both mitigating downside risk AND driving upside potential.
- To get the most value from simulations, you need to use inputs that tie to specific activities that have performance variability that is grounded in a team’s ability to deliver so the simulation can be used to understand the relative importance of each of the activities.
- With an understanding of the relative importance of each activity, management can focus on ensuring the team has the right capabilities in place with enough capacity to deliver the performance that’s needed to deliver the base business potential with a focus on unlocking the upside potential.